
By: Garrett Kilcer
In this post, we will be diving into the analytics of back to back games in the NBA. What does that mean? What is their history in the league? Do they make any significant difference?
What’s the Big Deal?
The NBA has a long regular season, 82 games in fact. These games are stretched out from October to April. With the sheer amount of games and the timeframe to put them in, some of these games get put on back to back nights.
Some NBA players complain about having to play games so close to one another without a break in-between but, is it really that big of a deal? When I was 14 and I played AAU basketball, it was not uncommon to play two or even three games in a single day.
So what’s the issue? Did I, at 14, have more endurance than Steph Curry? Well I don’t want to get too far into the weeds on that but… could Steph Curry run in a Cross Country meet at the Varsity level?
Anyways, it is important to know where the league used to be and where they are now.
Days of Yore
Under the old system, teams were playing more congested schedules. It was very common for teams to play their first game of the season on October 30th or Halloween (the 31st) and play until early to mid-April. This would lead to situations where teams would be playing on back to back nights frequently as well as 4 games in 5 days.
Not only could back to back games make players tired or potentially perform worse than they normally would, but some players may sit out these games. If a player is on a minutes restriction due to injury or just nursing a reoccurring problem, they may sit out the second night of a back to back. This is obviously something that league would want to avoid.
If LeBron was nursing an injury and his team was playing an East coast team away on a back to back, he may sit out. This is bad for the fans and the league because LeBron only goes to Charlotte, for example, once a season. Fans would be upset that they missed out on seeing him play due to a scheduling issue.
This was changed during the 2017-18 season. The main difference that most people would notice is that, the NBA regular season would start on October 17th. Starting the season 2 weeks earlier allowed the schedule to be more spread out. Just four years earlier, there were 70 cases of teams playing four games in five nights. With this earlier start, that scenario had been completely eliminated.
More relevant to our current question was that the average amount of back to back games per team had dropped from 16.3 to 14.41. During the 2022-23 season, the average amount of back to back games was 12.9 with all teams being scheduled for between 11 and 15 of those such games (with exception of the Washington Wizards who played 16 due to a game that got rescheduled for weather).
Going back to the earlier scenario with LeBron sitting out a game in Charlotte, new rules have been imposed to curb that behavior. This season, the league announced that the so called “load management” will be reigned in so that star players play more often, especially in nationally televised games. On JJ Redick’s podcast, “The Old Man and the Three”, NBA commissioner Adam Silver expressed that resting players did not help prevent injury and alluded to the fact that it could even lead to more injuries2.
To clarify, since Adam Silver took over the job of NBA commissioner from David Stern in 2014, he has taken great strides to give teams and players more rest in-between games moving the start of the season up and changing schedules around to be more travel friendly. However, this season he has taken a stand against players resting. All that being said, reducing back to back games does not help with player health. That must mean this was an effort to get a better product and have teams and players perform better with a day off in between games right? Well let’s find out.
Statistics Pitstop (sorry)
Before getting too far into the data and graphs, there does have to be a small statistics lesson unfortunately. I’m sorry, I really am. Whenever I tell someone that I have a degree in statistics, this is usually how the conversation goes:
Them: “I took a statistics course once”
Me: “Ya, it’s pretty interesting stuff right?”
Them: “I hated it”
I will try to make this as quick and painless as possible but this is just so you have a better understanding of how comparisons are made.
In statistics, comparing two different averages is very important. This is where a t-test would come in handy. For example, when flipping a coin ten times, if it lands on heads seven of those times, you might say that the coin must be weighted because it lands on heads 70% of the time. A t-test could be run for this and it would show you that the coin is “probably not” weighted.
The two-sample t-test, which we will be using for our purposes, compares the averages of two different samples to determine if they come from different populations. The test takes into account the standard deviation and the sample sizes of each group being considered and gives us one number.
The standard deviation is how far apart the numbers are from the average. For example the numbers 10 and 2 have an average of 6 and the numbers 5 and 7 have an average of 6. However, the group of 10 and 2 will have a higher standard deviation due to the fact that they are more spread out. This would mean that it would be harder to predict what the next number in the series would be compared to the group of 5 and 7. (This will be important later)
The one number that gets spit out at the end will be compared to other numbers on a grid that depends on sample size and how sure we’d like to be. If our number is higher than the one on the grid, we can be fairly certain that the averages are different.
The reason I said “probably not” earlier is that we can never be 100% sure with just the math alone. The threshold that we usually like to hit is 95% confidence. Imagine flipping a coin 100 times and getting 95 heads. You’d be pretty sure that you were flipping a weighted coin right?
What Did We Find?
All the data collected was sourced from NBA.com and ESPN.com. The first thing that I did was go through every team’s 2022-23 schedule and track the box score for every game that was played on the second night of a back to back. I collected team score, opponent score, win or loss, home or away, whether the combined scores went over or under, and whether or not the team that was on the back to back covered the spread.
To answer a question very quickly, the betting lines resulted in nothing interesting unless you think odds makers being very good at their job is interesting. The percentage in which teams covered the spread was 50.1% and the over in the game hit 51.9% of the time. So if you came here to get an edge on the book, I’m sorry to inform you that you might as well flip a coin.
The first thing that you may want to know would be, how does the scoring between a regular NBA game and a back to back game change? Pooling all teams, the average amount of points per game scored in a night is 114.69 and the average points allowed per game is also 114.69. If we are looking at only back to back games, these numbers change to 113.46 points scored per game and 115.88 points allowed per game.
Here’s how the difference breaks down per team. First points scored then points allowed.


Looking at these graphs, it’s easy to see some outliers but the overall trend of the averages above is supported. So is there a significant difference?
When we actually compare the averages above using the two-sample t-test, these numbers are not so different. Given that we are comparing two groups, one with a sample size of 82 (# of games in an NBA season) and one with a sample size of~13 (average # of back to back games each team plays), and that we would like to be at least 95% confident, our t value must be bigger than 1.661.
After running the numbers between these, the t value for points scored is 1.361 and points allowed is 1.07. So unfortunately there is no real difference between a regular game and a back to back.
As this might be the case, if you saw the above graphs and thought something was strange then you are not alone. Specifically on the points allowed graph, three teams in particular jump out of the pack. The Los Angeles Lakers, San Antonio Spurs, and the Sacramento Kings. They all give up way more points per game on a back to back as opposed to on a regular game. Why might that be?
My mind immediately went to two things. First thing is age. If a team is older on average, recovering after a game may be more difficult. While the Kings and the Lakers are both on the older side of the league at an average age of 26.4 and 27.1 respectively, the Spurs were one of the youngest teams in the NBA at 23.8.
The other thing I thought of was pace of play. This number refers to, on average, how many possessions a team has during a regulation length game. This is were I found an interesting trend.
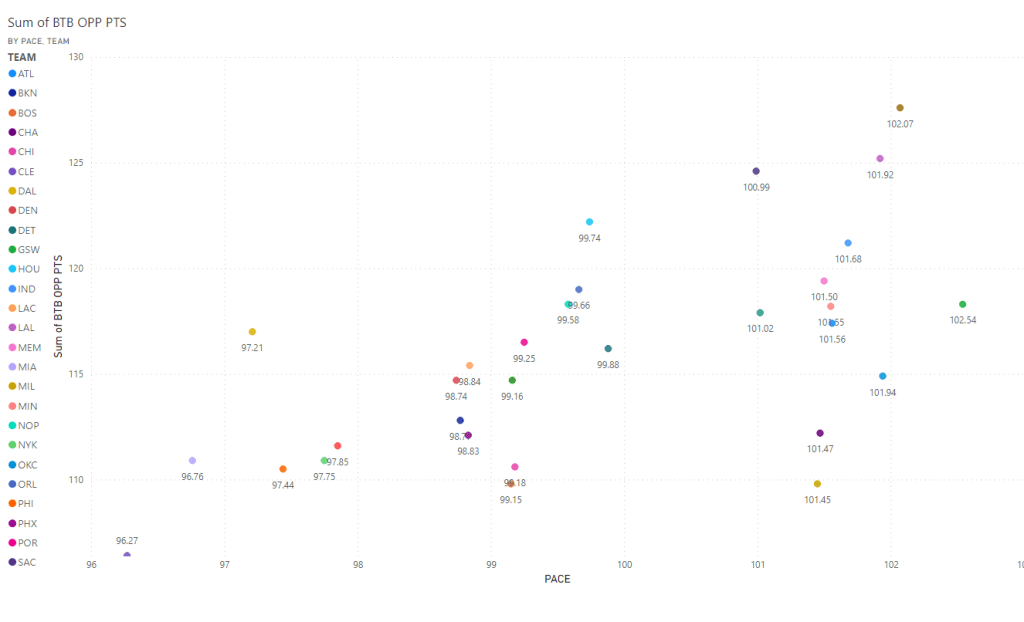
The graph above plots the pace of play on the x-axis and the average points allowed on the y-axis. Due to the amount of teams, I was not able to fit them all into the legend but it is not difficult to see a slight trend that would show the faster a team plays, the more points they tend to give up on the second night of a back to back.
The top three points on this graph are the Spurs, the Lakers, and the Kings. They all rank in the top 10 in pace.
A Second Look
“But wait!” I hear you yelling in the distance. “You are comparing every game that a team plays with back to backs and within those 82 games, there are back to back games that skew the data!” you continue to implore.
I pause. I think for a moment. “Shoot, they’ve got a point” I concede.
So what do I have to do now? Do I go back through about 70 different box scores for 30 different teams? No that would be insane.
Instead, I multiply the average amount of points that each team scores per game by 82 and then subtract that by the average amount of points each team scores on a back to back multiplied by the amount of back to back games and then divide that number by 82 minus the amount of back to back games each team played.
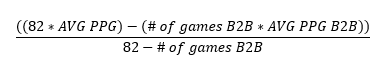
For example, the Bucks averaged 116.9 points per game for 82 games. Multiply those numbers together and the Bucks scored about 9,585.8 points in all games combined. Conversely, they averaged 111.2 points in 12 back to back games. Multiplying those together gets you 1,334.4 points scored. When you subtract 1,334.4 from 9,585.8 you would get 8,251.4 which is the amount of points that they scored in games that were not back to back. The only thing left to do would be to divide that by the number of games that were not back to back which, in this case is 82-12 which equals 70 and then you have you answer: 117.9.
Now the person that yelled at me earlier may be a stickler and they might say, “How can they score .4 of a point? That is just an estimate of all the points they scored and not the real number.” To that I say shut up.
As before, here are the new graphs plotting the points scored and points allowed between back to back games and games with rest.
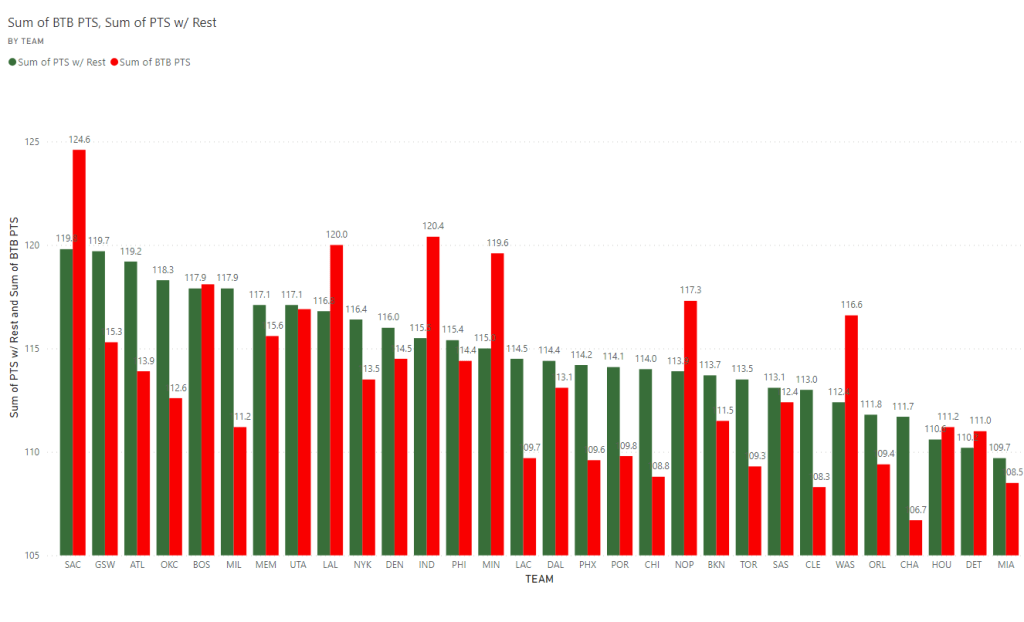

With that all squared away, the average points per game for teams with at least one day of rest is 114.89 and the average points allowed is 114.46. Not a huge difference between the earlier samples but nonetheless, let’s compare the two.
The back to back games average stays the same at 13 but the other changes now to 69 which is the average amount of games each teams play with at least one day rest. So the new t value that we are aiming to be higher than is 1.664.
Now the t value for points scored is 1.557 and the t value for points allowed is 1.266. This means that there is no difference between how much a team scores or allows depending on how much rest they’ve had.
“You Play to Win the Game. You Don’t Play to Just Play it.”
There are two more things that need to be discussed before we wrap this up and the first of those is winning. Teams aren’t scoring or allowing more points on these games so there shouldn’t be a big signal showing that they are winning more or less games on a back to back correct? Well let’s have a look.
The average NBA team during the 2022-23 season has a win percentage of 51.3% when they have at least one day of rest between games and a win percentage of 43.1% on back to back games. This certainly is not nothing. The back to back win percentage is even more interesting if you take into account that teams win 55.6% of their home back to back games and an appalling 33.9% of their road back to back games.
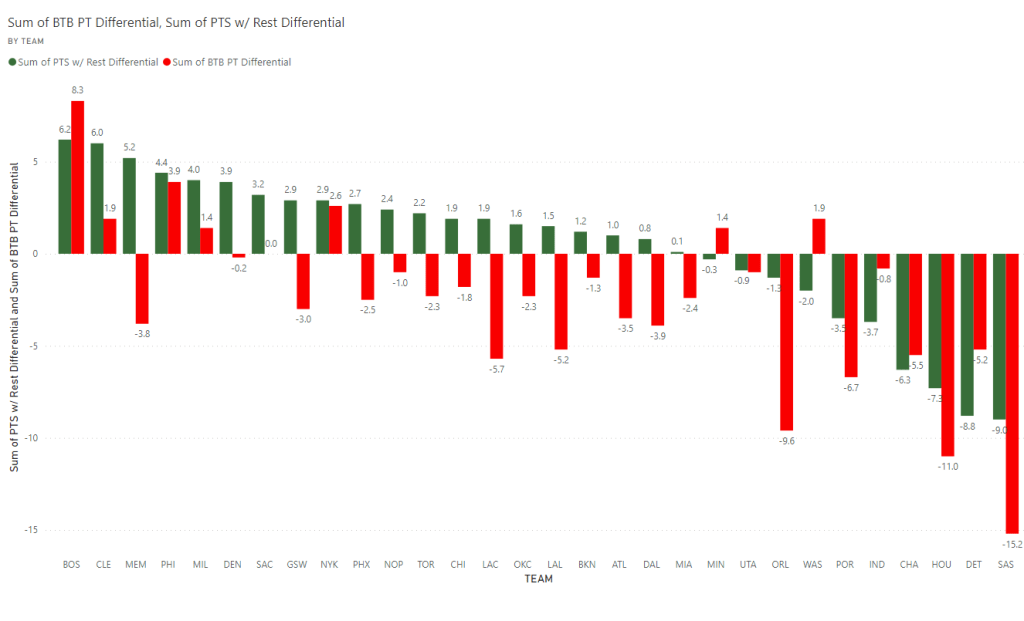
The graph above demonstrates this perfectly. The green bars represent the average point differential for a game with rest whereas the red represents the average point differential for a game on a back to back. Take the Toronto Raptors for instance, with rest, they outscore their opponents by 2.2 points per game but on a back to back, that gets flipped and the end up getting outscored by 2.3 points per game.
Using the same t value as before of 1.664 to compare ours against, we end up getting a value of 2.069. This means that I can say with confidence that a team will lose more often with no rest than with at least one day of rest.
How can this be? How can teams be no better at scoring or defense with rest but still end up winning more often? The secret lies within the standard deviation.
The standard deviation for scoring on back to back games is so much higher than normal games that you can get very crazy box scores but still end up with the same average. Earlier I used the example of a group of 10 and 2 and a group of 5 and 7 both averaging 6. Well to convert this into NBA terms, the group of 10 and 2 are back to back games and the group of 5 and 7 are games with rest.
The scores are so wildly different for back to back games that they can result in the same average but the game outcome becomes less predictable. During this season, the Kings beat the Clippers 176-175 which was a back to back game for the Kings. There is also a game where the Knicks played and won on a back to back 92-81. Of course both of these games resulted in wins for the team on the back to back but you get the point.
What Should (but won’t) Happen
Basketball is without a doubt the most physically demanding sport that requires professional athletes to compete on consecutive nights. As the data shows, this is not good for the team that is playing that game on the second night. What should the NBA do?
Well if they decide to move up the season again, they risk putting too much of their season in contest with the NFL. A contest that they will surely lose. Christmas, a day that the NBA has historically done very well due to the fact that they have five games with ten of their most popular teams playing, was not kind to them in 2022. The highest rated game for the NBA that day was Bucks-Celtics peaking at 6.03 millions viewers.
In contrast, the NFL had three games on that day and their worst game was Buccaneers-Cardinals. This game, mind you, was played between two teams below .500 and the Cardinals were starting a third string quarterback and it peaked at 17.15 million viewers3.
So then they should put more breaks in between the games and make the season finish later. This runs into a different problem. If they drag the season out too long, people may start to lose interest. Also, they may lose viewers due to the weather getting nicer and people not wanting to spend their summer nights watching the Nuggets play the Pistons.
That only leaves one real answer. Play less games. It seems so simple. This is what makes football so intriguing every week. Each team only plays 17 games so every game means so much. This would put more weight on regular season games as well as give the league the opportunity to spread out the matchups more and eliminate back to backs. Of course this will never happen because if we shorten the schedule, that means the teams make less money. All I’m asking for is a 62 game season.
Even Doc Rivers, a man that won one championship with a loaded roster so he will be forever employed no matter how many times he messes up, doesn’t like back to back games. His Bucks played in Dallas on Saturday and the next day had to play in Utah. He came out against the schedule makers in a press conference saying that whoever scheduled that game “has never been on the airplane before or knows time zones4“.
For now, NBA teams must play on back to back nights to appease the powers that be and us fans will shed tears over how tired these millionaires must be.
Citations:
[1] Zillgitt, Jeff (August 14th, 2017) https://www.usatoday.com/story/sports/nba/2017/08/14/nba-schedule-commissioner-adam-silver-focuses-player-rest-health/567038001/, USA TODAY
[2] Reddick, JJ. “A Brutally Honest Conversation About Load Management | Adam Silver and JJ Redick” YouTube uploaded by JJ Reddick, 9 November 2023, https://www.youtube.com/watch?v=C0uuqp7d_o0
[3] “On Christmas, the NFL’s average audience was five times larger than the NBA’s” (December 29th, 2022), https://www.nbcsports.com/nfl/profootballtalk/rumor-mill/news/on-christmas-the-nfls-average-audience-was-five-times-larger-than-the-nbas, NBC Sports
[4] Dugandzic, Matthew (February 7th, 2024) https://www.si.com/nba/bucks/news/doc-rivers-says-five-game-road-trip-was-brutal-for-milwaukee-bucks, si.com


Leave a comment