
By: Garrett Kilcer
In this post, I look at the 31 NFL drafts from 1970-2000 to see when future Pro Bowlers and Hall of Famers were picked and if these talents are getting selected earlier over time.
Prologue
As time moves forward and technology advances, the general idea is that we can make things and do things better. We are told each iPhone that comes out is better than the one before. Phones are not hung on the wall in the kitchen and attached to a cord. You can order a stranger off the internet to pick you up in their car and drive you wherever you’d like, without a word. Admittedly, a lot of out advancements seem phone related. Does this advancement also apply to sports?
In the NBA, offenses have never been better than they are right now. In the 2000-01 NBA season the Los Angeles Lakers lead the league in offensive rating at 107 points per 100 possessions. This season that mark would be good for third worst in the league. Currently, the Indiana Pacers have an offensive rating of 122.5. Even eight years ago, when the Golden State Warriors won a record 73 games, their offensive rating was 113.5. That mark would put them in tight contention with the Washington Wizards who currently have a record of 3-16. This not only shows that sports can be optimized but should be to keep up.
This leads me to the NFL. Putting together an NFL roster is challenging. Multiple positions and 53 players to fill it out, every spot matters. Drafting matters. So much is put into the NFL draft from sending scouts to college games, the NFL draft combine, and interviews with players and coaches. No stone is left unturned when it comes to selecting a player for your squad. But does this work? Have we been getting better at identifying talent?
Ideally, all the teams are looking to select the best of the best in the first couple of rounds of a draft. So, one would assume that almost all of the future pro bowlers and Hall of Famers are selected early and that, since we should be getting better year after year, there will be an underlying trend to follow. Now there will always be exceptions and outliers but, for the most part, there shouldn’t be a large amount of the available talent still left on the board after the fourth round or not drafted at all.
The Cruel Nature of 1s and 0s
To test this, I looked at the 31 NFL drafts from 1970-2000 to see just how good the league has gotten at picking the best players early. I went through each year and scored the rounds to see how much talent there was and where they were picked. Each player that made a pro bowl during their career was awarded one point and a future Hall of Famer was awarded three points.
Before getting into the data, a few disclaimers must be addressed. I am aware that the point of the draft is not to just draft the best available player. Sometimes it is more important to add a player that will fill a role well instead of getting a player that is good but redundant. For example, I do not believe a team with an MVP caliber quarterback like the Chiefs would draft another quarterback in the first round even if they believe that player will go on to be impressive in the league (I’m looking at you Green Bay).
Another thing this data will not account for is players that played good, long careers but never got these accolades. I am not discounting these players but, if there is a Hall of Fame tackle taken in the fifth round, a team would probably rather have them over the non-Hall of Fame tackle that they took earlier.
Lastly, there is one more thing that no one can anticipate or quantify. Let’s say a wide receiver gets drafted in the fourth round but in their first game they get injured and when they come back, they have a hard time earning their spot. Or maybe a cornerback gets drafted in the first round but the team is not interested in developing them and they fall out of the rotation. In both instances, these players could have gone on to become greats but given their circumstances, they were not given the opportunity.
It seems unfair that, 50+ years later, I come along and say something like “Wow the Steelers really whiffed on this guy. What were they thinking?” But unfortunately, I do not deal with hypotheticals. These things are unknowable and trying to make sense of them is an exercise in futility.
With that out of the way, let’s get into it.
What Did We Find?
The first graph we will look at today is the overall points per year. This will show the amount of points each draft class had overall including undrafted players.
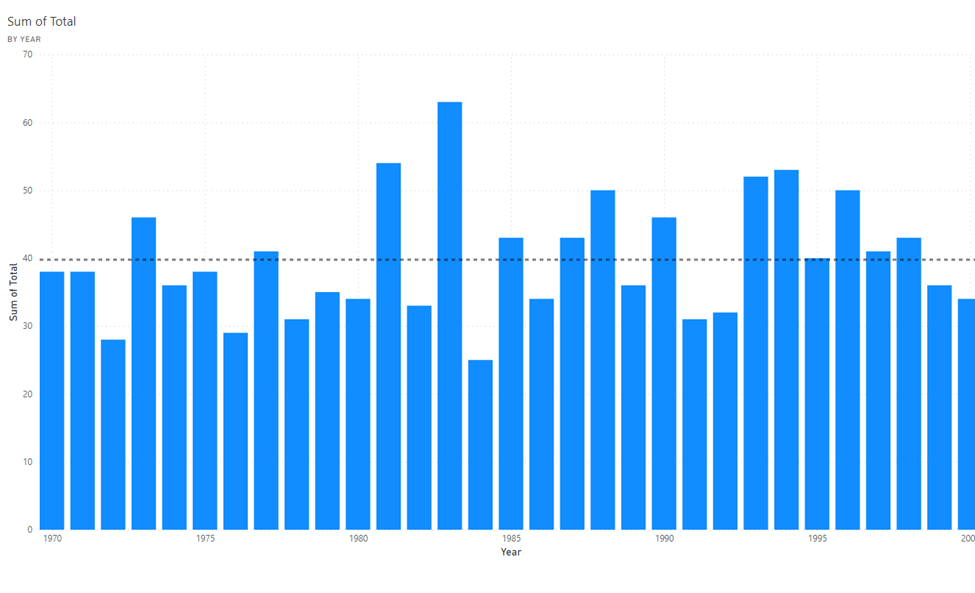
Looking at this graph, the first thing that you probably notice is the really big line right in the middle. That would be the famous 1983 draft which was headlined by greats like John Elway, Jim Kelly, and Dan Marino. This draft scored a 63 on my scale. The dotted line shows the average score of each draft class which is 40.
Another thing that you may notice is that the right side of the graph seems slightly higher than the left side. The first 15 years have an average of ~39 points per season but if you take out the 83 draft, average drops to 36. The right 16 years have an average of 41 points. This would mean that, on average, more recent drafts have been providing either a couple of more pro bowlers or even two more Hall of Famers than in the past.
This could be because more emphasis has been put on player development. Potentially, teams are understanding more and more the impact of missing on picks. Another reason could be that, there are less multiple time pro bowlers and it gives the opportunity for more guys to get in for maybe their first and only time. As stated before, this data doesn’t account for the amount of pro bowl appearances each person has and it also doesn’t account for players who deserved to be recognized as a pro bowler but were passed over for someone who had previously made the cut.
The next series of graphs display the percent of points that are earned in the first round. Ideally looking at these graphs, the percentage should be high and if we are lucky, getting higher over time. I would say, if you can get about 50% of the top talent in the first round, that would be good. They are the best so finding them above the rest should be easy, right?
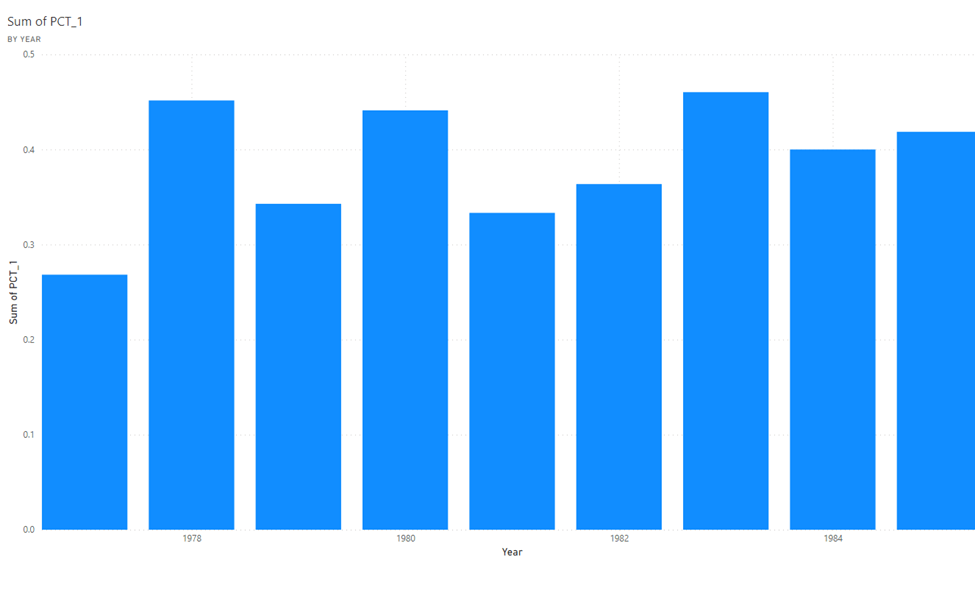
The graph above is the percentage of the points that were encapsulated by the first round from the years 1977 to 1985. Looking at the percentage on the y-axis, the numbers are a little lower than I would’ve hoped but this was over 40 years ago and look! These numbers are slowly rising! Humans are amazing and we can learn from our previous mistakes and grow to be better! Right?
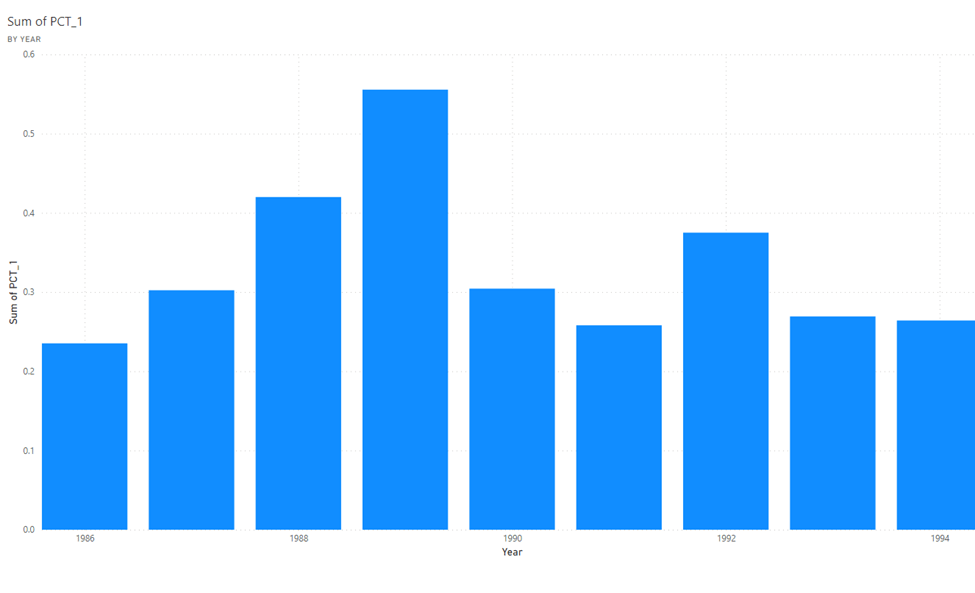
Well, these are the nine years directly following the graph above. Six of these drafts fall at or below 30%. This means, by my grading system, 70% of the top talent in these drafts fell out of the first round.
What happened? I thought we were getting better at this whole drafting thing. What’s so significant about these nine years that is different from those that came before it? The only thing that I can find is that all these drafts took place in the same venue, The New York Marriott Marquis. Is this place cursed? Not that I can find but in 1985, before the building was opened Paul Goldberger of The New York Times called it “…a gargantuan mass of concrete and glass, looming over Times Square like an upended bunker.” [1] Which I think is a fun anecdote.
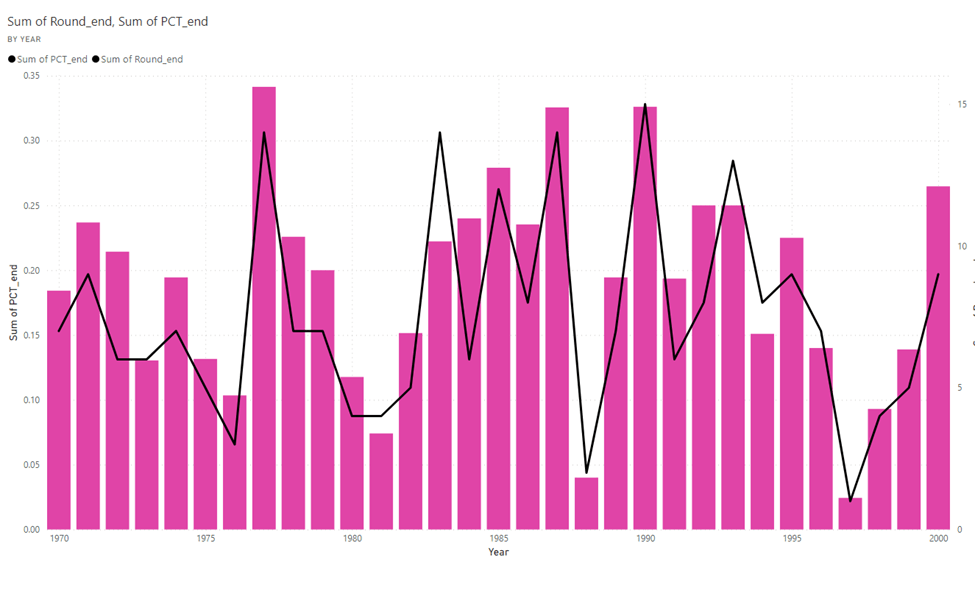
With that mystery still unsolved, here is what the full graph looks like.
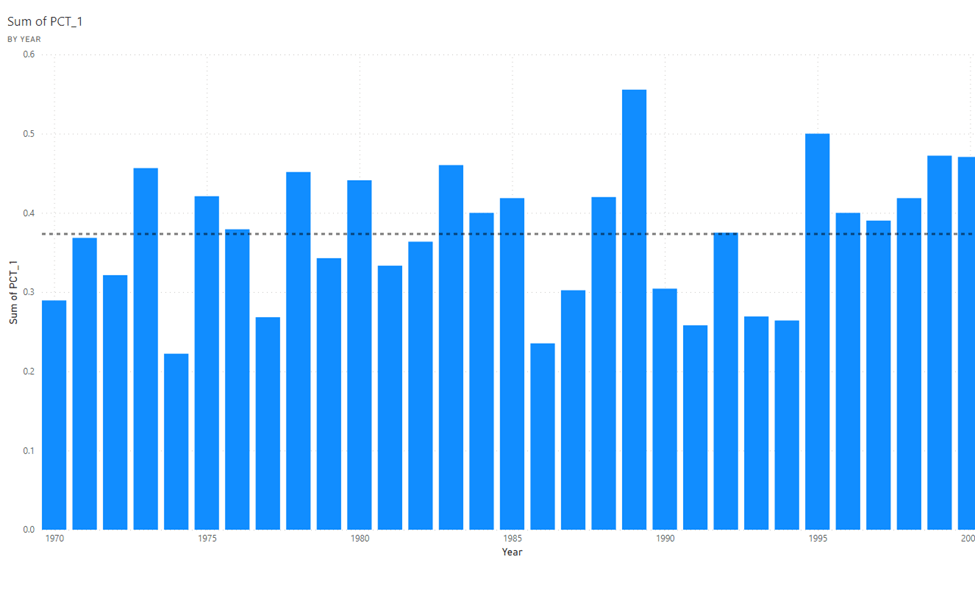
The only real way to describe this chart is that it “ebbs and flows.” Some years are good and some are not so good. The dotted line represents the average which hovers just above 37% of the total points for the whole draft.
Maybe things aren’t all bad though. Sure, teams are not getting a large majority of the talent in the first round but maybe they are picking that up in the second and third rounds as time goes on. This would mean that, even if the percentage isn’t going up in the first, it should be going down in late rounds and undrafted guys. With the late round graph, since some drafts have more rounds than others, the way I counted points across the 31 years was first-round, second-round, third-round, fourth-round, the rest of the draft, and undrafted. The main thought here was, really after the fourth round, are you actually expecting to get pro bowl talent? Probably not.
Above is the graph for all rounds after the fourth. The columns again represent the percentage of the points tallied by the left y-axis and the line represents the total amount of points tallied by the right y-axis. Below will be the graph for the undrafted rookies with the same layout.
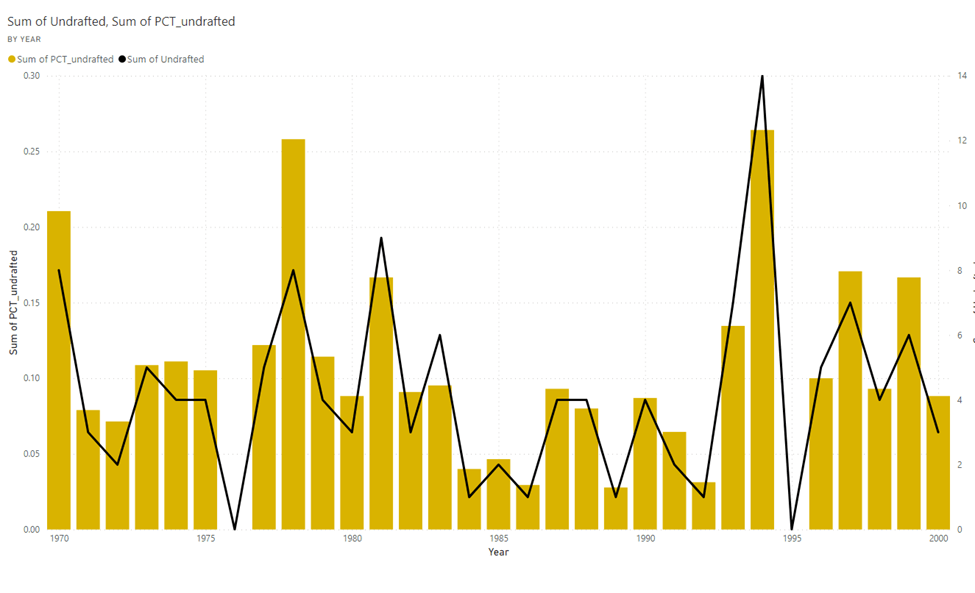
Between these, there is good news and there is bad news. The bad news is, there is no downward trend. Top players are slipping through the cracks year after year. The good news is, these numbers are low compared to the first round. More talent is getting picked up earlier in the draft. As a basic overview, here is how each round that was tracked breaks down on average.
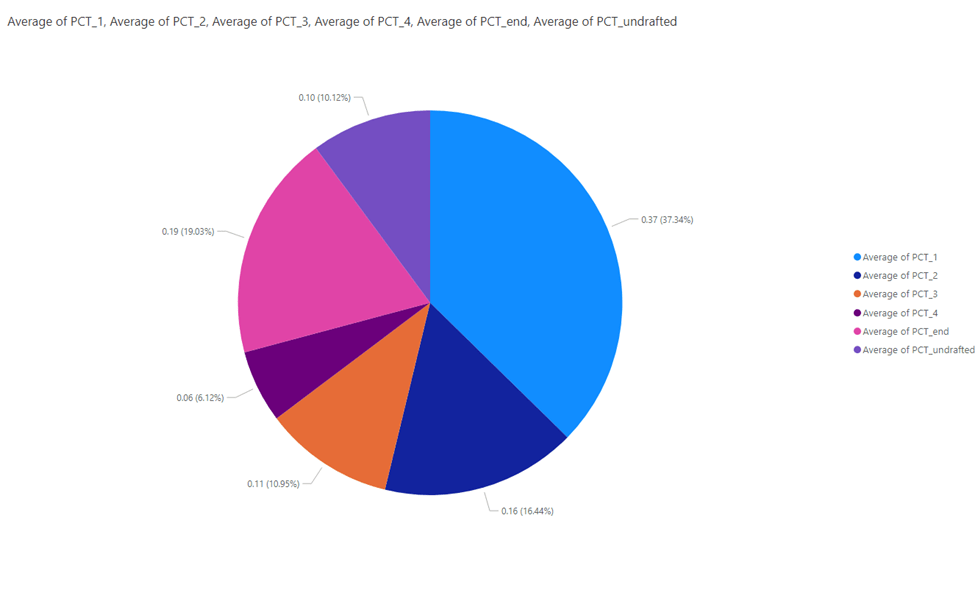
As you can see, there is still a lot to be had later in the draft, but if you miss on your first-round pick, almost 40% of the top talent is off the board already.
It’s Not All Bad
If you were hoping to read this entry and point to this as evidence of human advancement, well, I’m sorry to disappoint. In terms of scouting, we are not perfect. A lot of early draft picks do not pan out and it does not seem like it’ll ever be an exact science.
On the bright side, because of that, talent can be found anywhere. If you are a team with mostly late picks or a prospect who is sliding in the draft, there is a chance that things could turn out great. In a way, is that not why we love sports? Anything can happen and anyone could make a difference.
[1] Goldberger, Paul (August 31st, 1985) https://www.nytimes.com/1985/08/31/nyregion/marriott-marquis-hotel-an-edsel-in-time-sq.html, The New York Times


Leave a comment