
By: Garrett Kilcer
In this post I research the correlation between Winning Percentage and Defensive Percentage for the best to ever do it. If you just want the numbers, skip the Background section. It’s cool, really I don’t mind.
Background
The date is February 7th, 2021 and I am finishing my graduate program at the University at Buffalo. I am 21 years old and watching the Super Bowl between the Tampa Bay Buccaneers and the Kansas City Chiefs with my friends. This matchup is between Tom Brady, winner of 6 Super Bowls and leading a Tampa Bay Squad that, mid-way through the season, some did not think would make the playoffs and Patrick Mahomes who had just won his first Super Bowl the year prior.
Patrick Mahomes and the Chiefs showed no signs of slowing down after their first Super Bowl win claiming the most yards on offense this season. Leading the way for this offense were two of the most dynamic weapons in the league, Travis Kelce and Tyreek Hill who finished 2nd and 8th in the league in receiving yards respectively. Travis Kelce, in fact, set the record for Tight End receiving yards in a season. Needless to say, this was an offense that could move the ball in a hurry.
As we all know, the Tampa Bay Buccaneers did end up winning this year with a score of 31-9. Which was an absolute shock given that the Chiefs had scored below 20 only 1 time all season. The Chiefs scored 3 field goals and were denied from the endzone while Patrick Mahomes threw 2 interceptions. This was truly an amazing defensive performance from Tampa Bay.
For some context into how I fit into this, I am a fan of the Buffalo Bills. I was born into what we within the “Bills Mafia” call “The Drought”. This was the 18-year period where the Buffalo Bills failed to reach the post season. Some years we would go in thinking “this year is it; we can do it this time!” Fan favorites during this time include the likes of Ryan Fitzpatrick, Fred Jackson, Marshawn Lynch, and Stevie Johnson to name a few.
Every game, the broadcast would put up a graphic that included teams that had failed to reach their respective post seasons for consecutive years and the Bills always had topped this list. It was made tougher by the fact that the Patriots, who share a division with the Buffalo Bills, were seemingly unstoppable during this period.
This leads me to the Tom Brady of it all. I had a front row seat to all of Tom Brady’s success. Not just the bridesmaid to his bride but the bitter non-invitee to the wedding all together. So, watching Tom Brady win another Super Bowl at the age of 21 after watching him dominate my team for my entire life felt like a punishment from the heavens above. It felt as though this torture would never end.
All this aside, the next moment is what inspired the inception of this project. Tom Brady wins Super Bowl MVP.
This made me livid. I had watched Tom Brady my entire life and had watched him win and my team lose. I was bitter and angry that after this, he gets all the credit. The Buccaneers just held one of the most electric offenses in the league with a great young Quarterback and 2 of the best pass catchers to below 10 points. What did Tom Brady have to do with that?
That night I had decided to start this project. I wanted to know, throughout Tom Brady’s career, how much of his success could be attributed to his defenses. I would compare it to other Hall of Fame Quarterbacks to see who had been carried to prove that Tom Brady was not as amazing as everyone claims he was.
Since that day, it has been almost 3 years. In that time, I have obviously gotten older, Tom Brady has retired, and my Buffalo Bills have had success in the league. Of course, the Bills have not yet won the Super Bowl but, success nonetheless. This is no longer the hit-piece I originally envisioned. After compiling the numbers and charting the Quarterbacks against their defenses and each other, I would rather look at it objectively and maybe shine the light on some of the players that did the most, despite what they were given on the other side of the ball.
How Data is Presented
Before getting straight into the data, a little background into how it was collected. I recorded the winning percentage of current Hall of Fame quarterbacks (and Tom Brady) each year and charted it against what I call Defensive Percentage. While coming up with how I would track defenses across multiple decades and eras I ran into a problem. At first, I wanted to use something simple such as yards or points allowed per game but comparing those numbers across eras would not be fair to the more recent quarterbacks who played in a more pass-heavy game. Next, I thought to use the overall rank but the issue with that is, if your defense was last in a league with only 26 teams it looked better than the worst defense in a 32-team league. So finally, I settled on a fraction. Defensive Percentage would go like this:
This insured that, if your team had the number 1 defense in the league, the fraction would be 1 and the worse your defense was, the closer to zero the number became. So, the number DP represents would be, including that team, how many defenses that team is better than.
For example, if in a 26-team league, the defense was ranked 14th, the DP would be equal to (27 – 14) / 26 which is 0.5, half the league.
This still does favor teams that played in smaller leagues since coming in last in an 8-team league would result in a DP of 0.125 and coming in last in a 32-team league would result in a DP of 0.03125. However, I could not assume that since a team came in last out of 8 teams, they would still come in last out of 32.
Another data point that I collected was the outcome of each season. I kept track of whether the team made the playoffs and whether they won the Super Bowl. The way I counted this is, if the team won the Super Bowl, it would be counted as a 1. If they made the playoffs, it would be counted as a 0. If they missed the playoffs all together, it would be counted as a -1. This may seem a bit intense of a punishment. The only way to cancel out a year missing the playoffs is to win the Super Bowl? Well, if wins are such an important quarterback stat that people would like to point to when comparing them, then that number should be as close to zero or above since all these quarterbacks are the best we have ever seen.
The last thing that needs explanation is the seasons that were tracked. Only seasons where the quarterback in question started half or more of the games was counted. I felt that seasons where they did not have a hand on the outcome of the game more times than not, should not count. It seems obvious but figured it should be said nonetheless.
The Results
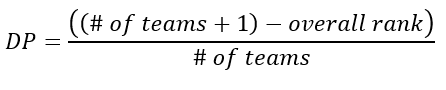
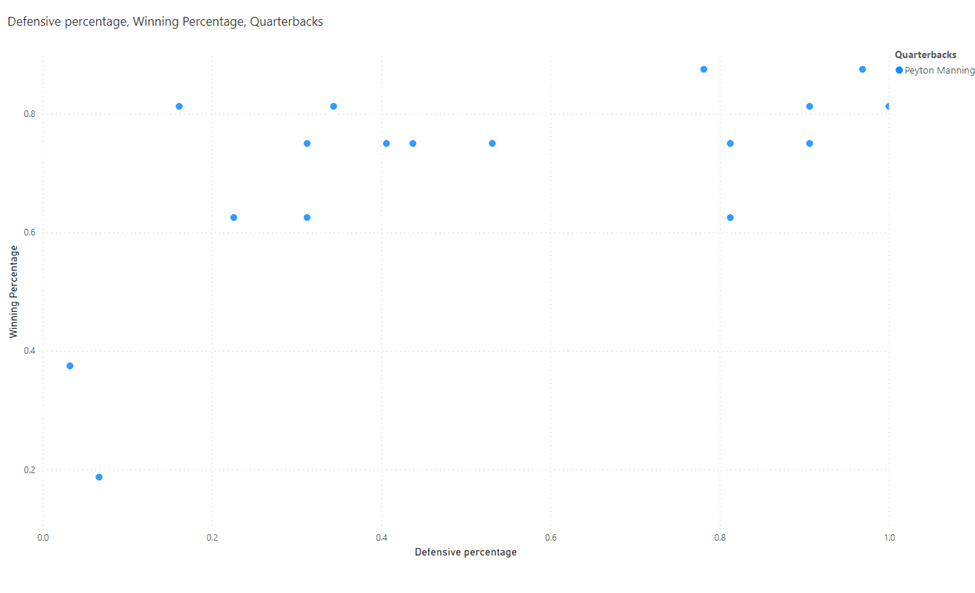
Before delving into specific quarterbacks, I would first like to show some overall data from all those tracked. This first graph shows all seasons that were tracked for all quarterbacks.
The closer to the right a dot is, the better the defense and the higher up it is, the higher the winning percentage is. Of course, this graph by itself is a bit much. There is a lot tracked here and a lot to digest. My main takeaway here is, besides some outliers, the data has a positive trend.
So now you are probably thinking to yourself, ‘Wow, what a discovery! Hall of Fame Quarterbacks win games. Who would’ve thought? Glad I read through this just for that to be the conclusion.’ Well hold your horses, there is more to talk about so why not hear me out.

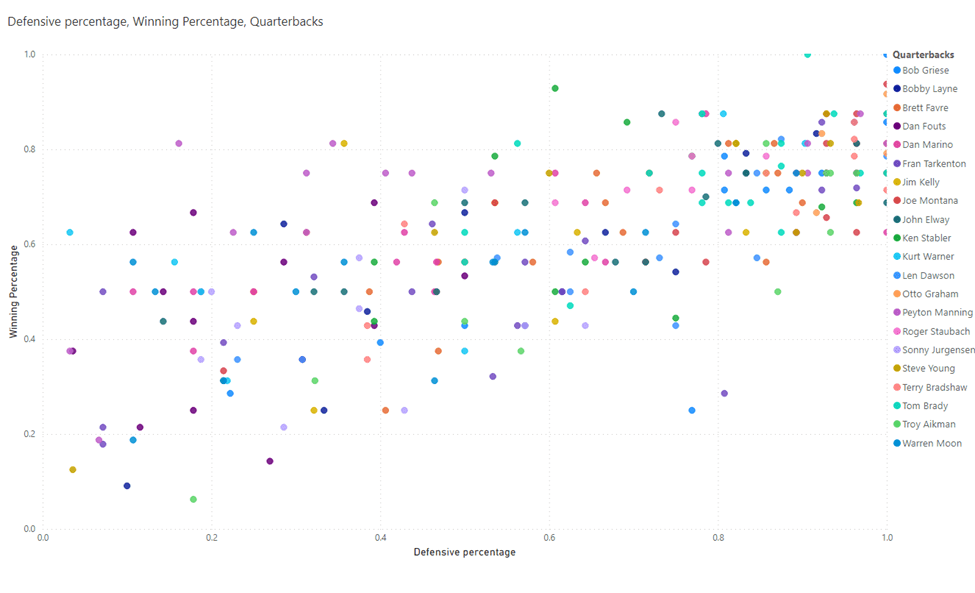
The above graph plots the average Defensive Percentage of each quarterback against their average season outcome which I had labeled as “Playoffs?” in my dataset. If the average of the season outcome is above 0 then the quarterback won the Super Bowl more often than missing the playoffs. This is obviously a tremendous feat, as so many players in the league may never make it to the big game and 4 of these lucky fellas had come to expect winning it more than missing the post season at all.
Now, you’re smart, you can see that those 4 “fellas” have the top 5 average defenses on this list. Also, as you move to the right and the defenses get worse, the season ending result favors missing the playoffs all together. This point is only made all the clearer in the next graph.
The correlation between Winning Percentage and Defensive Percentage is almost uncanny. Something to keep in mind when looking at these visuals is, these are the best quarterbacks of all time. There are media members in the Hall of Fame selection committee that have watched, played, and just flat out know more about football than me. That 49-person committee has decided that these are the best of all time.
The Peyton Manning Corollary
I could end this here. I could say that, if you have a good quarterback, it will not win you games unless you can pair him with a good defense. But I cannot say that. The reason stopping me from doing that is that Peyton Manning exists.
Eagle eyed readers may have spotted some interesting dots and stats on the above charts. Below is a zoomed in view of our first graph. I have zoomed in the top left of the chart to show the seasons where defenses where in the bottom half of the league but the winning percentage was still at .500 or above.
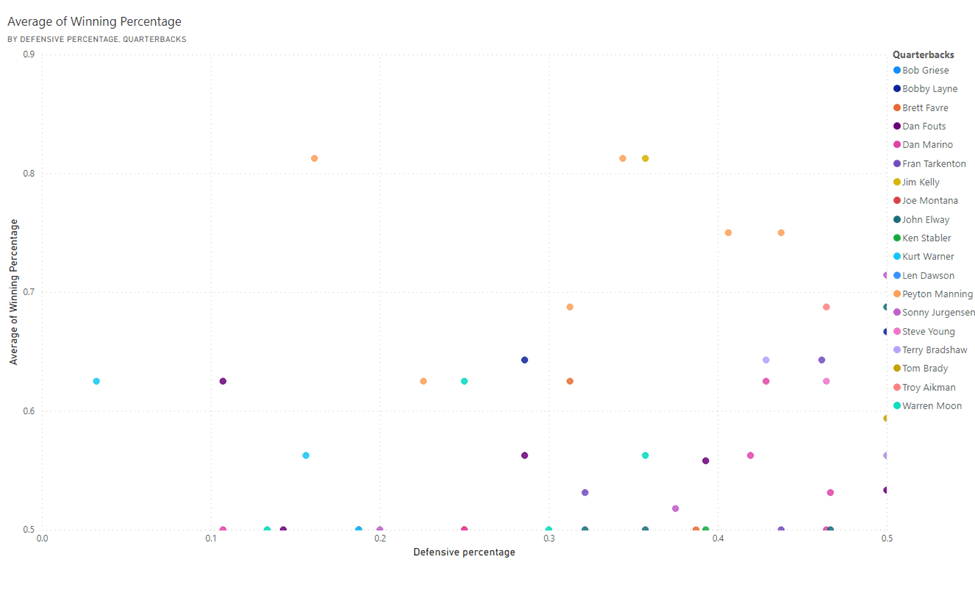
What I would like to draw your attention to is the 3 dots at the top of this graph. These 3 seasons are some of the most impressive that I have charted and 2 of them belong to Peyton. This guy wins games regardless of the situation. Also, worth mentioning, that Jim Kelly is the third dot at the top there and the blue dot all the way to the left is Kurt Warner. That is correct, Kurt Warner won 10 games with the worst defense in the league.
If we zoom out and only look at Peyton Manning’s dots on the first graph, it shows that, if you give Peyton Manning anything besides a bottom 2 defense in the league, he will win you 60% of the games.
The dominance was shown on the career average Winning Percentage and Defensive Percentage graph as well (See figure 3). Peyton Manning had the same Winning Percentage as Joe Montana who had, on average, the second-best career Defensive Percentage.
I could stop here but that would be doing Peyton a disservice. Out of the bottom 15 quarterbacks charted in terms of Defensive Percentage, only Peyton Manning had a season out come of 0. Meaning his Super Bowl wins and playoff misses canceled out which is something only 6 of the 21 quarterbacks can say and the other 5 are in the top 6 of career Defensive percentage. (See figure 2)
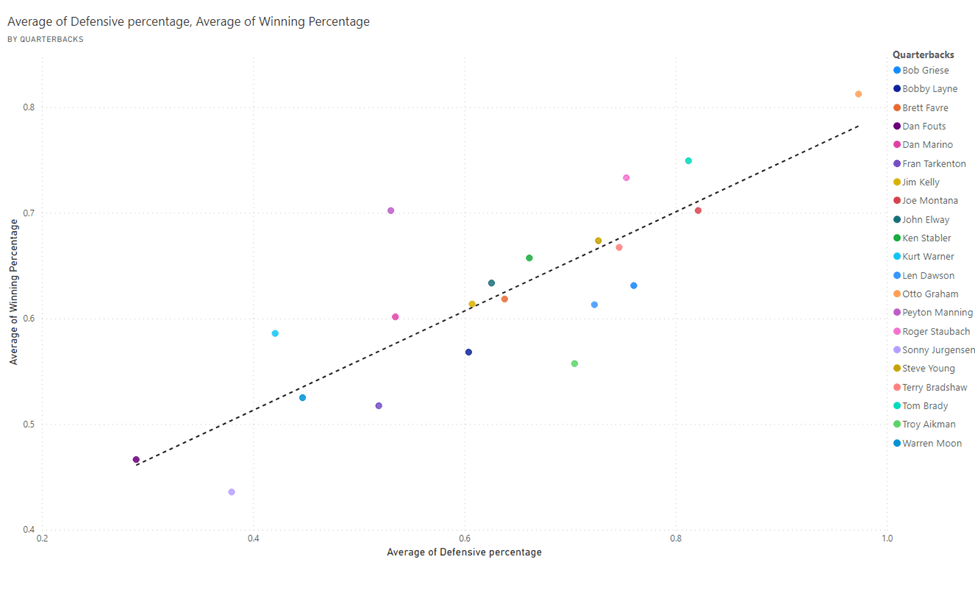
The last graphic that I have is season outcome plotted against Defensive Percentage. This graphic is not very interesting. It very much drills home points that are better proven with other visuals. However, there is one thing about this graph that makes it worth showing.
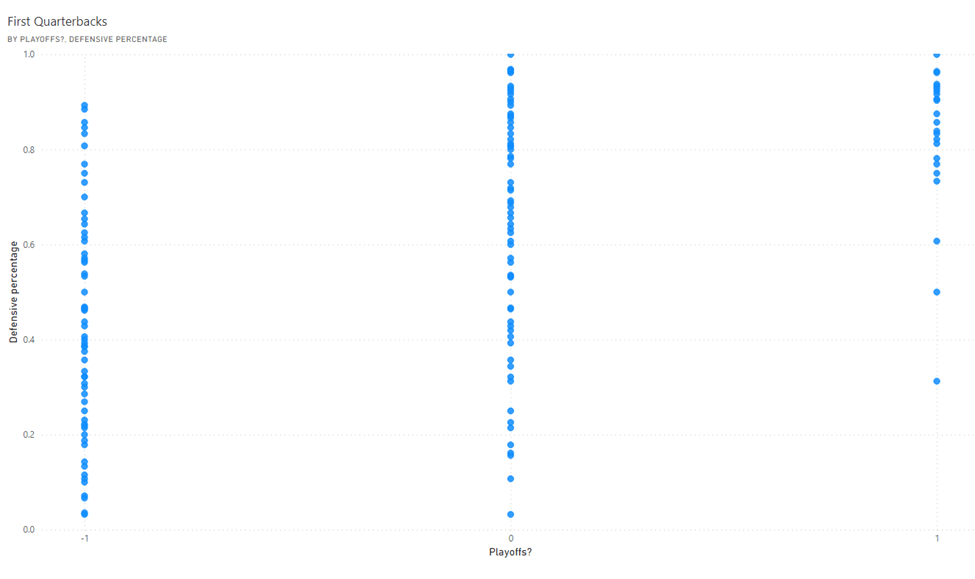
As you can see, there is a small positive trend to post season success so it is not as informative as the others. But, 1 quarterback won the Super Bowl with a Defensive Percentage of 0.31. That quarterback was Peyton Manning.
Final Thoughts
Back to the question that bothered me years ago, is Tom Brady a fraud? I would say no but also, he is no god. Going back to figure 3, he had the third-best career Defensive Percentage and the second-best Winning Percentage. This is not to take anything away from him. His longevity and the records that he holds speak for themselves. I do not want the conclusion to be that, if you give anyone a good defense, they are bound to win 7 Super Bowls.
Wins are not a quarterback stat. Too much goes into winning a football game that cannot and should not be put on a quarterback. Famously, the 2010 San Diego Chargers had the best offense and defense in the league and they missed the playoffs due to mistakes on special teams.
I believe that some stats that can be used to quantify how well a quarterback is playing is QBR (Total Quarterback Rating), passer rating, and EPA (Expected Points Added). But above all, actually watch the game. I believe that there is a lot about the game that can’t be quantified. Film analysis is important to understand what happened on the field. A screen pass that goes 90 yards for a touchdown and a 90-yard drive that lasts 12 plays gives each quarterback the same amount of passing yards but the work load on the quarterback in each example is drastically different.
If you leave this with anything, it is, unless the quarterback of your team is Peyton Manning, don’t put too much pressure on them. Even if they are a future Hall of Famer, there is not much they can do with a bad defense.


Leave a comment